You Are Running a $6M Operation. You Cannot Answer 'Which Project Manager Is Most Productive.'
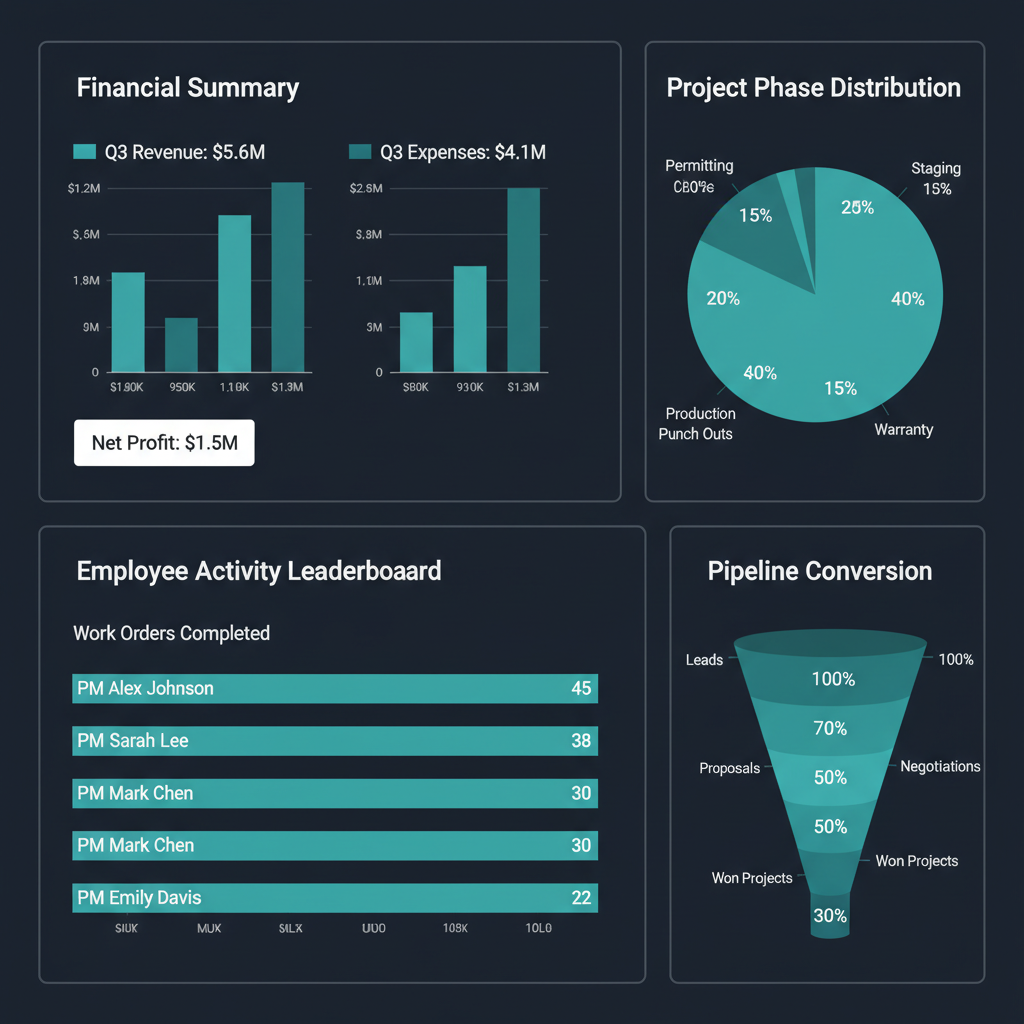
WFP's reporting portal covers every dimension of your operation — financial performance, project analytics, sales pipeline health, and employee activity — all generated from the work your team already does inside the platform. No manual data entry. No separate reporting tool. The reports build themselves as your company operates.
Your Monthly Financial Review Tells You What Happened. It Does Not Tell You Why.
Marcus sits down with his bookkeeper on the first Friday of the month. She has the P&L open. Revenue is up 15% over last year. Expenses look normal. But Marcus has questions she cannot answer: Which of his three PMs completed the most work orders last month? Which project type — pools, outdoor kitchens, or renovations — has the highest average margin? How many leads entered the pipeline last month, and how many converted? Which projects have been sitting in the staging phase for more than three weeks?
His bookkeeper points him to QuickBooks for some numbers. For the rest, she suggests asking the PMs. Marcus makes a mental note to follow up on Monday. By Monday, he has forgotten the questions because three new issues took priority.
The result: Marcus manages a multi-million dollar operation based on financial statements that tell him what happened last month and gut instinct about what is happening now. He has no analytical layer between the P&L and the daily operational chaos. No per-project profitability view. No employee productivity comparison. No pipeline health metrics. No audit trail of who did what this week.
Financial reporting tells you where the money went. Operational reporting tells you where it is going. WFP gives you both.
The Solution
Financial. Operational. Sales. Employee Activity. One Reporting Portal.
WFP's reporting is not a separate module you configure. It is the analytical layer of the operating system — built from the data your team generates by doing their jobs.
Every Dollar, Every Project — Without Manual Data Entry
WFP generates financial reports from the transactions already flowing through the platform — draws collected, expenses tracked, job costs allocated, and per-project profitability calculated. Marcus does not need to export data to Excel and build pivot tables. The financial picture is always current because it is built from live operational data, not from monthly reconciliation.
Which Projects Are Moving? Which Are Stalling? Which Are Profitable?
Project-level reporting shows phase duration averages, step completion rates, and per-project financial performance. Marcus can see that his pool projects average 11 weeks from permit to warranty, but his outdoor kitchen projects average 16 weeks — and investigate why. The attention queue data feeds into reporting so stalled projects are not just flagged in real time; they are tracked historically for pattern recognition.
Pipeline Health Is Not a Feeling. It Is a Report.
CRM data flows into reporting to show lead volume by source, conversion rates by sales rep, average quote size, and pipeline velocity. Marcus can see that Derek closes 40% of his leads but his average quote is $95K, while the new rep closes 25% at an average of $160K. This data informs compensation conversations, hiring decisions, and marketing spend allocation.
Who Did What, When, and From Where — Without Micromanaging
WFP tracks employee logins, project views, work orders started, work orders completed, and work orders edited per employee, per day, per week, per month. This is not surveillance. It is accountability. If Marcus suspects a PM is underperforming, the data confirms or disproves it. If Jessica manages twice as many active work orders as the other PM, the data validates her request for a raise. Every action has a timestamp and a user, creating a complete audit trail for operational review, dispute resolution, or compliance purposes.
Need the Data Outside WFP? Export It.
For companies that use external BI tools or need to share reports with accountants, investors, or partners, WFP supports data export for offline analysis. The reporting portal handles daily operations; exports handle board meetings, tax preparation, and due diligence.
The Difference
What QuickBooks Reports and Basic Software Dashboards Cannot Show You
Employee Activity Audit Trail
QuickBooks tells you how much you spent. It does not tell you who completed 47 work orders last week and who completed 12. Buildertrend and JobTread have basic user tracking, but neither provides the per-employee, per-action breakdown WFP offers — logins, views, edits, completions, all timestamped and attributable. This is the data that turns "I think he is not pulling his weight" into "the numbers show he completed 60% fewer work orders than the team average."
Cross-Dimensional Reporting
Most construction software treats financial, project, and sales data as separate reporting silos. WFP's reporting portal connects all three dimensions so Marcus can trace a trend from pipeline (lead volume dropping) to project (fewer active builds starting) to financial (revenue shortfall in 90 days). This is operational intelligence, not just data visualization.
Reports Generated From Operations, Not Manual Entry
Many reporting tools require someone to enter the data that populates the report. WFP's reports are built automatically from the work your team is already doing — managing projects, completing work orders, collecting draws, updating lead statuses. If your team uses WFP, the reports maintain themselves. No double-entry. No "updating the report" as a separate task.
Sixty Active Projects. Complete Clarity on Every Single One.
A construction company managing over sixty simultaneous active projects maintained complete operational clarity — not because the owner reviewed every project individually, but because the reporting portal surfaced exactly which projects needed attention, which PMs were most productive, and which financial indicators required action. At that scale, managing by gut feel is impossible. Managing by report is the only option. WFP makes the reports automatic.
Very intuitive to just jump into it and figure things out fairly quickly just by poking around.
Most construction software includes basic financial reports — job costing, profit/loss, and invoicing summaries. WFP goes further with project analytics (phase duration, step completion rates, stalled project tracking), sales pipeline reports (lead volume, conversion rates, quote averages), and employee activity tracking (logins, work orders, audit trail). All reports are generated from live operational data.
WFP's employee activity tracking shows logins, project views, work orders started, work orders completed, and work orders edited per employee, per time period. This is not time tracking — it is output tracking. You see what each team member actually did inside the platform, not just how many hours they claimed. The audit trail records who did what, when, and from where.
Yes. WFP's financial reporting shows per-project profitability — revenue collected vs. costs allocated — so you can identify which project types, which PMs, and which municipalities generate the highest margins. This data informs which jobs to pursue and which to price differently.
WFP's reporting covers operational, project, sales, and employee data that QuickBooks does not touch. For pure accounting — tax preparation, payroll processing, general ledger management — most companies still use QuickBooks or a similar accounting tool. WFP's financial reporting complements accounting software by adding the operational layer: per-project profitability, draw collection tracking, and cash flow forecasting that accounting tools were not designed for.
Employee activity tracking in WFP records every significant action a user takes inside the platform — logging in, viewing a project, starting a work order, completing a work order, editing records. This creates a per-employee productivity profile and a full audit trail. It is used for performance evaluation, accountability, dispute resolution, and operational transparency. It is not surveillance — it is the same principle as commit logs in software development.
Yes. WFP supports data export so you can use reports in external BI tools, share them with accountants or investors, or incorporate them into board presentations. The reporting portal handles daily operations; exports handle external stakeholders.
WFP is $2,500/month — one price, unlimited users, unlimited projects, full access to all features including the reporting portal, employee activity tracking, financial dashboards, project analytics, and everything else. Reporting is not an add-on. It is included. See the full pricing breakdown at /pricing.
Explore More of the Platform
See how this feature connects to the rest of the platform.
See the Reporting Portal That Builds Itself From Your Operations
Get a personalized demo showing financial reports, project analytics, employee activity tracking, and pipeline health — all generated from the work your team already does.
Schedule a DemoUnlimited users. Unlimited projects. One price.